By Tim McGuire, Taylor Roche, and Andreas Weinberger, Mercedes-Benz RDNA, Inc.
More than 100 hydrogen fuel cell vehicles in the Daimler AG (formerly DaimlerChrysler) test fleet are operated by ordinary drivers in real-world driving conditions around the world. For development purposes only, each vehicle is equipped with a powerful telematics system that captures data on vehicle performance and driver usage patterns—from the vehicle’s GPS coordinates, fuel tank fill level, and vehicle velocity to the position of the gas pedal beneath the driver’s foot. Our team is responsible for translating the millions of drive files accumulated by the test fleet into MATLAB based automated reports and Web applications.
Daimler engineers use these tools to understand vehicle usage patterns, track fuel consumption, plan hydrogen refueling infrastructure, and understand how driving patterns affect vehicle performance. By examining this data, Daimler can evaluate not only the vehicles’ health, but also the best locations for future hydrogen fueling stations, and identify characteristics of vehicle use to create a diverse vehicle base for future fleet operation.
Understanding Usage Patterns
Fleet vehicles actively operating in various driving conditions and climates accumulate diverse data sets for analysis. Each vehicle transmits its data via a Daimler wireless infrastructure to a central database. Our team developed an automated reporting system that examines vehicle usage to provide us and our customers with fleet usage feedback.
Customers in Japan, Singapore, USA, Europe, China, and Australia are using Daimler’s fleet of zero-emission vehicles for everyday transportation. Inside each vehicle’s fuel cell, a reaction of hydrogen and oxygen produces electricity to power the motor. Because the only byproduct of this reaction is water vapor, fuel cell technology holds great potential for reducing greenhouse gas emissions worldwide.
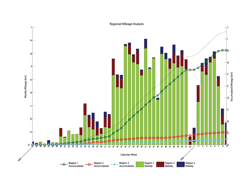
We use MATLAB and Database Toolbox™ to query the central database and retrieve odometer and GPS data for all vehicles in a particular region. Our MATLAB script filters out anomalous data, such as zero points reported by the GPS system and non-drive files. The script then processes all the data, generating a plot that sums mileage by time period and geographic region (Figure 1). Previously, Daimler used Excel to perform this analysis, a task that required hundreds of engineer-hours to set up, a full-time employee to maintain, and many manual steps to complete each time. Today, an automated MATLAB script lets the team access the same results via a Web browser

Figure 1. Sample regional mileage analysis. Click on image to see enlarged view.
Figure 1 shows a sample fleet mileage accumulation plot on both a continual and weekly basis. This analysis uses GPS data to link mileage accumulation to the region in which the vehicle was driven, enabling Daimler to evaluate locations and customers for future fleet operations based on regional driving patterns. At an operator’s request, similar plots can be generated for individual vehicles to provide a detailed view of their activity.
The regional mileage analysis plot reveals a sudden reduction in mileage in late December and early January. By quantifying seasonal trends in vehicle usage, Daimler can schedule vehicle maintenance and diagnostics procedures during the holiday season and other low-use periods.
Tracking Fuel Consumption
Using a tool that we developed with MATLAB and Mapping Toolbox™, Daimler engineers can reconstruct any trip taken in a test vehicle. Tool users can track the fuel tank state of charge (SOC), a measure of the amount of electrochemical energy available, along a satellite geographic map. Daimler initially developed this script to produce static JPEG map images. This solution was not flexible and provided insufficient details in the plot. Hence, the script was modified to produce Keyhole Markup Language (KML) files for use with Google Earth, which offers greater flexibility.
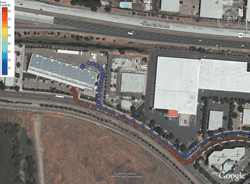
The sample fuel consumption analysis shown in Figure 2 tracks the tank fill level along the vehicle’s route. To perform this analysis, the MATLAB script correlates vehicle GPS and fuel tank SOC data using Mapping Toolbox functions.

Figure 2. Fuel consumption analysis. In this example we see the test car leaving the fueling station with a full tank (red) and returning with a nearly empty tank (blue). Click on image to see enlarged view.
Engineers can use these results to determine how fuel depletion rates are affected by the driving environment. By overlaying plots of hydrogen fueling stations and standard gas stations on the map, they can then evaluate the current fueling infrastructure.
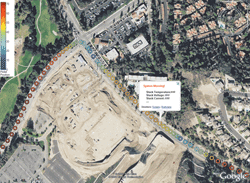
The MATLAB script that we developed also enables engineers to link real-world location to vehicle performance, simplifying remote diagnostics analyses on the worldwide fleet. For example, when the fuel cell system within the vehicle transmits an error code, we can use MathWorks tools to pinpoint and visualize the vehicle’s exact location when the error occurred (Figure 3). If we know, for example, that the vehicle was in downtown Los Angeles at rush hour, we can use our knowledge of the operating conditions at the time of the event to troubleshoot more efficiently.

Figure 3. Sample single-event analysis based on test vehicle data. Click on image to see enlarged view.
Planning the Hydrogen Refueling Infrastructure
To help place future hydrogen refueling stations in locations where they can most efficiently serve customers, we identify the areas most frequented by the fuel cell vehicles. Daimler uses MATLAB, Mapping Toolbox, and Google Earth to create spatial histograms based on the vehicles’ GPS data and geographic roadway data

Figure 4. SOC spatial histogram. Click on image to see enlarged view.

Figure 5. Spatial histogram analysis. Click on image to see enlarged view.
A spatial histogram overlays a grid on a geographic region, allowing Daimler to bin a signal of interest and depict it on a satellite geographic map. Figure 4 shows a spatial histogram of Singapore based on fuel tank SOC. The histogram in Figure 5 calculates the percentage of time the vehicles spend in each grid square. Combining these types of diagrams helps to pinpoint areas that are heavily trafficked by vehicles that are low on fuel.
Armed with the results of these analyses, Daimler engineers can recommend locations for new hydrogen refueling stations, enabling station operators to reduce risk by placing fuel stations near high traffic areas and giving customers more convenient access to hydrogen.
Analyzing Driving Patterns
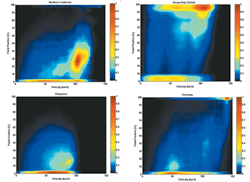
The Daimler fuel cell vehicle fleet spans the globe. We can analyze the position of each vehicle’s accelerator pedal to gain insight into how customers drive different vehicle types and how patterns vary across geographic regions. For example, pedal-position analysis (Figure 6) shows that the vehicle in Northern California is operated with moderate throttle use, while the heavy-duty vehicle is mostly driven at very light or full throttle without much in between. This analysis can provide feedback to engineers about a customer’s need for power. Engineers can then optimize control strategies and powertrains accordingly.

Figure 6. Pedal-position analysis. Click on image to see enlarged view.
When correlated with GPS data, this analysis can reveal regional trends in driving behavior. For example, in Germany we see frequent high-speed highway driving, where the pedal is pushed all the way to 100 percent. In Singapore, people drive more slowly and smoothly, and we rarely see a pedal depressed to more than 40 percent. Understanding these trends enables engineers to customize control strategies for different regions.
A Small Team Answers Big Questions
One measure of our success at providing useful results is the increasing demand for our services from engineers and managers at Daimler. We are swamped with requests. Being able to access the database, perform multiple analyses, plot results, and produce insightful reports in the integrated MATLAB environment is a big advantage. It means that we can easily add resources to our team.
Our engineers only need to know one software package—MATLAB—instead of multiple applications, and we do not have to spend time integrating diverse tools. Instead, we generate helpful results.
We continue to refine our current analyses and develop new ones to provide further insights and deeper understanding of fuel cell vehicle performance and infrastructure.
(转载)


